News


Does technology create economic value in your company – a look at the inner workings of ROI
Kert Kaljula, CFO of AIRE (AI & Robotics Estonia)
Processes and the starting point
Let us start at the beginning: the starting point for any ROI calculation is to identify which process the company wants to make more efficient through investments in AI and robotics.
A solution that works technologically is not automatically a profitable solution, but it can become one if the economic benefits of process improvements justify the investment. Functioning technology is a necessary, but not sufficient, condition.
Once the processes to be changed have been identified, the next step is to determine which key indicators the investment will affect: a) establish their baseline values; b) forecast their values after the investment. The benchmark is therefore the situation that would develop without the investment, but even that may change over time.
Narrow vs broad ROI
When investing in AI and robotics, it is necessary to distinguish between the return on a specific project and changes in productivity across the company. I have often seen a company manager start by reaching for the annual report to calculate what is changing in terms of productivity. The report provides useful background information, but on its own it does not isolate the impact of a particular investment from other changes.
For a specific investment, we are interested in a project-based, or narrow, investment appraisal: we look only at the processes and cash flows that the investment actually affects. Company-wide productivity, by contrast, combines the effects of many investments, market changes and management decisions, and does not allow us to assess the return on a specific project.
The investment appraisal framework and its three pillars
Every calculation rests on structure and logic. For the ROI calculation, I recommend a three-part approach. First, the initial investment: the expenditure on acquiring and implementing the solution, usually consisting mainly of CAPEX, or capital expenditure. Estimating this requires some preliminary work and requests for indicative quotations from system suppliers and consultants.
Second, OPEX, or the additional ongoing costs associated with the new solution, because, yes, a new solution does not just save costs; it can also create new ones. Here, we need to identify the additional ongoing costs arising from the investment. This is called an incremental change: a change compared with the situation without the investment, rather than the company’s total costs.
Third, the economic impact of the investment. This is the most complex of the three, because economic impact can take many different forms. Examples include savings in material, labour and energy costs; improved quality, leading to higher selling prices and revenue; or a broader product range and access to new customer segments. However, any additional costs required to achieve revenue growth must be deducted from it (so, when discussing revenue growth, we are actually talking about additional gross profit, rather than revenue). Nor does freed-up working time automatically constitute a financial saving: it must be shown whether costs decrease or additional saleable output is generated. Each benefit may be counted only once. While cost savings are often easier to estimate, assessing additional revenue almost requires imagination. But let us call it down-to-earth imagination, which must be supported by arguments and evidence.
Translating technical impact into cash flows
Once the three pillars are in place, the technical impact must be translated into cash flows and their timing established. The investment made at the start of the project is assigned to period 0. Benefits and costs in subsequent years are recorded in periods 1 to n; any additional investments beyond period 0 are recorded when they actually occur within periods 1 to n. An annual model usually assumes year-end cash flows; more precise timing should be used where necessary. The calculation might cover, for example, 5–10 years, but the time horizon must reflect the solution’s economic life and the reliability of the forecasts. For technology that becomes obsolete quickly, a shorter period may be justified.
At this point, it is important to emphasise that we translate into cash flows those impacts whose magnitude and timing we can reasonably estimate. Where necessary, we also account for changes in working capital and the residual value of the CAPEX assets at the end of the period. Impacts can be classified as direct, indirect and strategic.
Direct and indirect impacts may be translatable into cash flows. We leave strategic impacts as qualitative background information when their financial magnitude or timing cannot be reliably estimated. Examples include enabling further automation, creating new data capabilities or reducing dependence on workers with specific skills. The classification of an impact (direct, indirect or strategic) does not in itself determine whether it can be included in financial terms; what matters is whether the estimate is justified.
ROI as a general concept, IRR and NPV as specific metrics
Here, I use ROI as a general term for investment appraisal, rather than as a single percentage formula. For the calculations, I recommend three complementary metrics: a) IRR, or internal rate of return; b) NPV, or net present value; c) the simple payback period in years.
IRR and NPV share one very important feature: both account for the time value of money. This is crucial because the economic benefits of investments in AI and robotics emerge over several years, rather than immediately. A static ROI calculation ignores the time value of money and does not distinguish between the same benefit being generated over two years or ten. This seemingly technical difference can produce dramatically different results, with a static ROI calculation overstating the project’s rate of return compared with IRR – making it look more favourable than it is.
IRR expresses the project’s internal rate of return as a percentage. NPV shows the net value created by the project in today’s money, in our case euros. IRR alone says nothing about the size of the project: an investment of one million euros and an investment of ten million euros can both have an IRR of 20%. NPV fills this gap by showing the value created as an absolute amount after accounting for the required return. A positive NPV means that the project recovers the initial investment and also exceeds the selected required rate of return. I therefore recommend NPV as the primary financial decision criterion, with IRR and the simple payback period as supplementary indicators. A key input to NPV is the discount rate, or required rate of return, which must be chosen with the company’s cost of capital and the project’s risk in mind. The relationships between IRR, the required rate of return and NPV are as follows:
IRR > required rate of return → NPV > 0
IRR = required rate of return → NPV = 0
IRR < required rate of return → NPV < 0
The internal decision-making process
The result of an investment appraisal alone is not enough. The results must then be placed in the context of the company’s other investment opportunities and its minimum required rate of return, or hurdle rate.
At any given time, a company should have a range of investment opportunities “in the drawer”, with their returns assessed on a comparable basis, for example using NPV, IRR and the simple payback period. Having such a drawer provides a benchmark for each new investment opportunity and makes the decision – whether to invest or not – easier to reach.
The hurdle rate complements the ranking. For example, a company might set a minimum IRR of 20% for process improvement projects. This is an illustration, not a universal recommendation: the threshold must be justified by the cost of capital and the risk involved. Ranking first cannot, on its own, justify a project whose return falls below the required level. The hurdle rate and the NPV discount rate must be consistent; if they differ, the reason for imposing an additional constraint must be explained.
Scenarios
An investment appraisal should be tested using at least a few less favourable assumptions. A more thorough approach is to develop three scenarios: a base case, alongside pessimistic and optimistic scenarios. These vary a few key uncertain inputs, such as the achievable savings, implementation costs or how quickly the economic benefits materialise. Scenarios add depth to the calculation and help decision-makers understand both the risks and the opportunities of the project. The key question is: does the project still create value if the benefits arrive later than expected or turn out to be smaller?
Summary
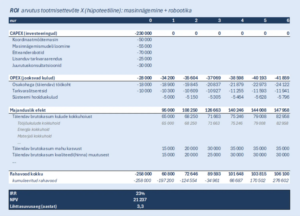
The example below illustrates the structure of an investment appraisal. A clear structure, understandable units and traceable assumptions make the calculation verifiable; good presentation alone, however, does not guarantee a correct result. The figures in the visual are illustrative and are not associated with any specific project. The example uses a required rate of return of 20%, which this particular project exceeds (with an IRR of 23%), resulting in a positive NPV.
Finally, the questions a company should be able to answer after an investment appraisal:
- What measurable process problem does the investment solve?
- What is the starting point and the benchmark?
- Which direct, indirect and strategic impacts have been taken into account?
- What additional cash flows does the investment generate, and when?
- What discount rate and time horizon are used to evaluate the project?
- What are the project’s NPV, IRR and simple payback period under different scenarios?
- How does the project compare with the company’s other investment opportunities and its hurdle rate?
Once these questions have been answered, the decision – whether to invest or not – is much better justified. A good investment appraisal does not eliminate uncertainty entirely, but it makes clear the assumptions under which the investment creates value for the company.
Share this entry